In this post I demonstrate how the capacity (e.g. classifier variance) changes in multilayer perceptron classifier with the change of hidden layer units.
As a training data I use MNIST dataset published on Kaggle as a training competition.
The network is multiclass classifier with single hidden layer, sigmoid activation.
Multi-class logarithmic loss
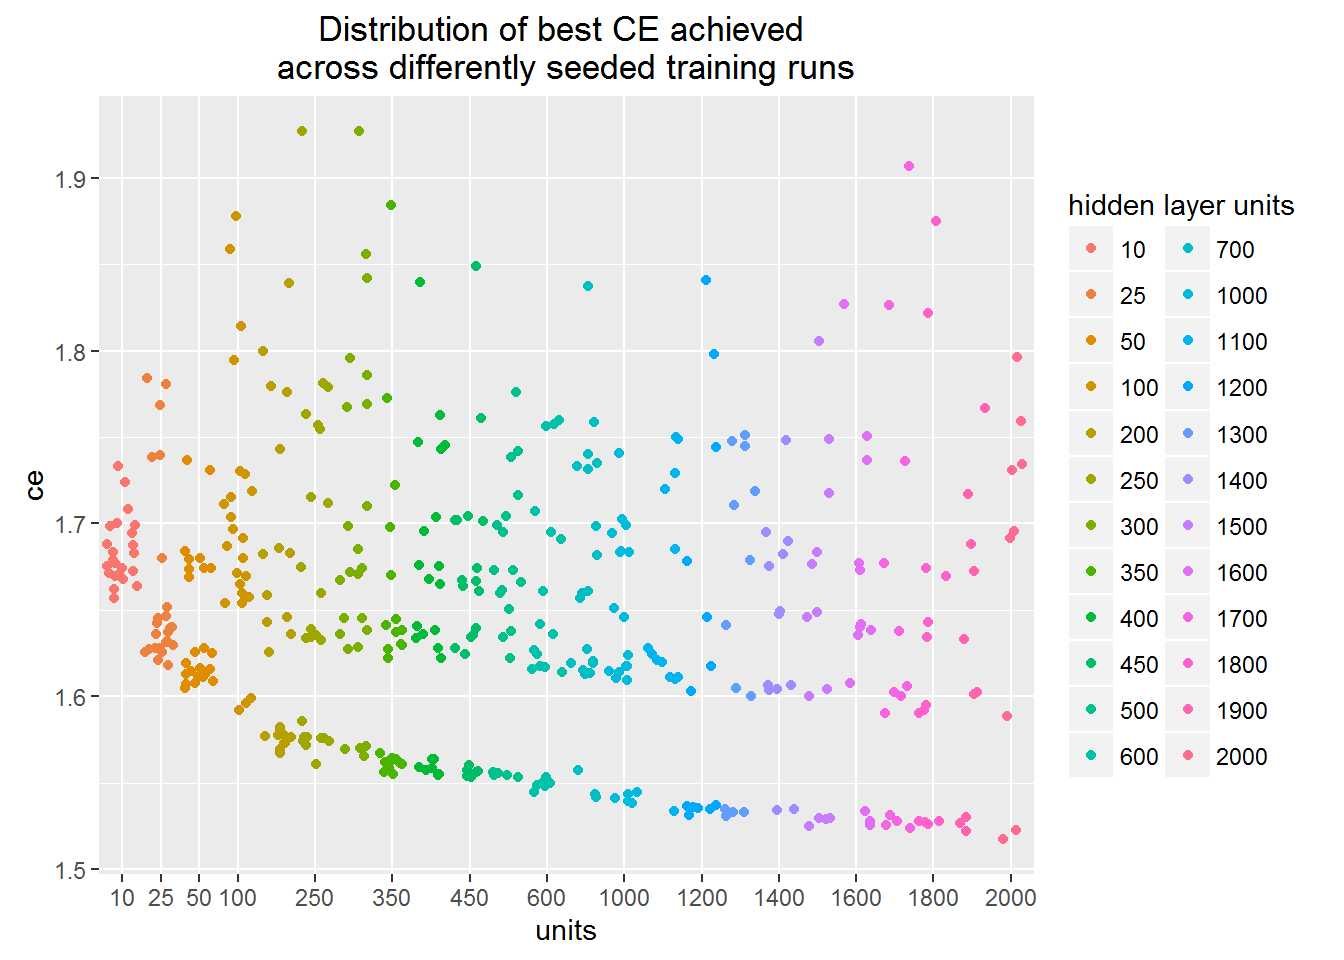
The plot shows the minimum value of loss function achieved across different training runs.
Each dot in the figure corresponds to a separate training run finished by stucking in some minimum of the loss function.
You may see that the training procedure can stuck in the local minimum regardless of the hidden units number.
This means that one needs to carry out many training runs in order to figure out real network architecture learning capacity.
The lower boundary of the point cloud depicts the learning capacity. We can see that learning capacity slowly rises as we increase the number of hidden layer units.
Classification accuracy
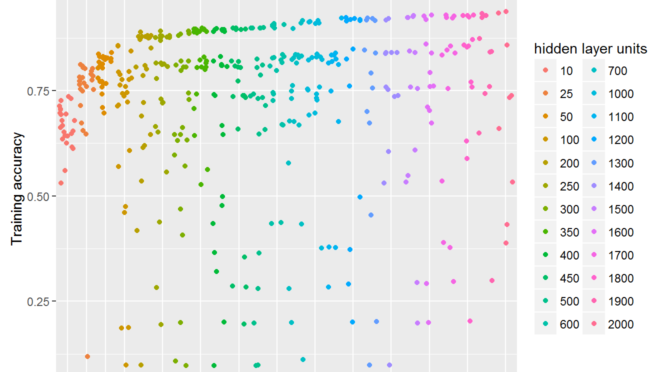
Learning capacity is also reflected into the achieved accuracy.
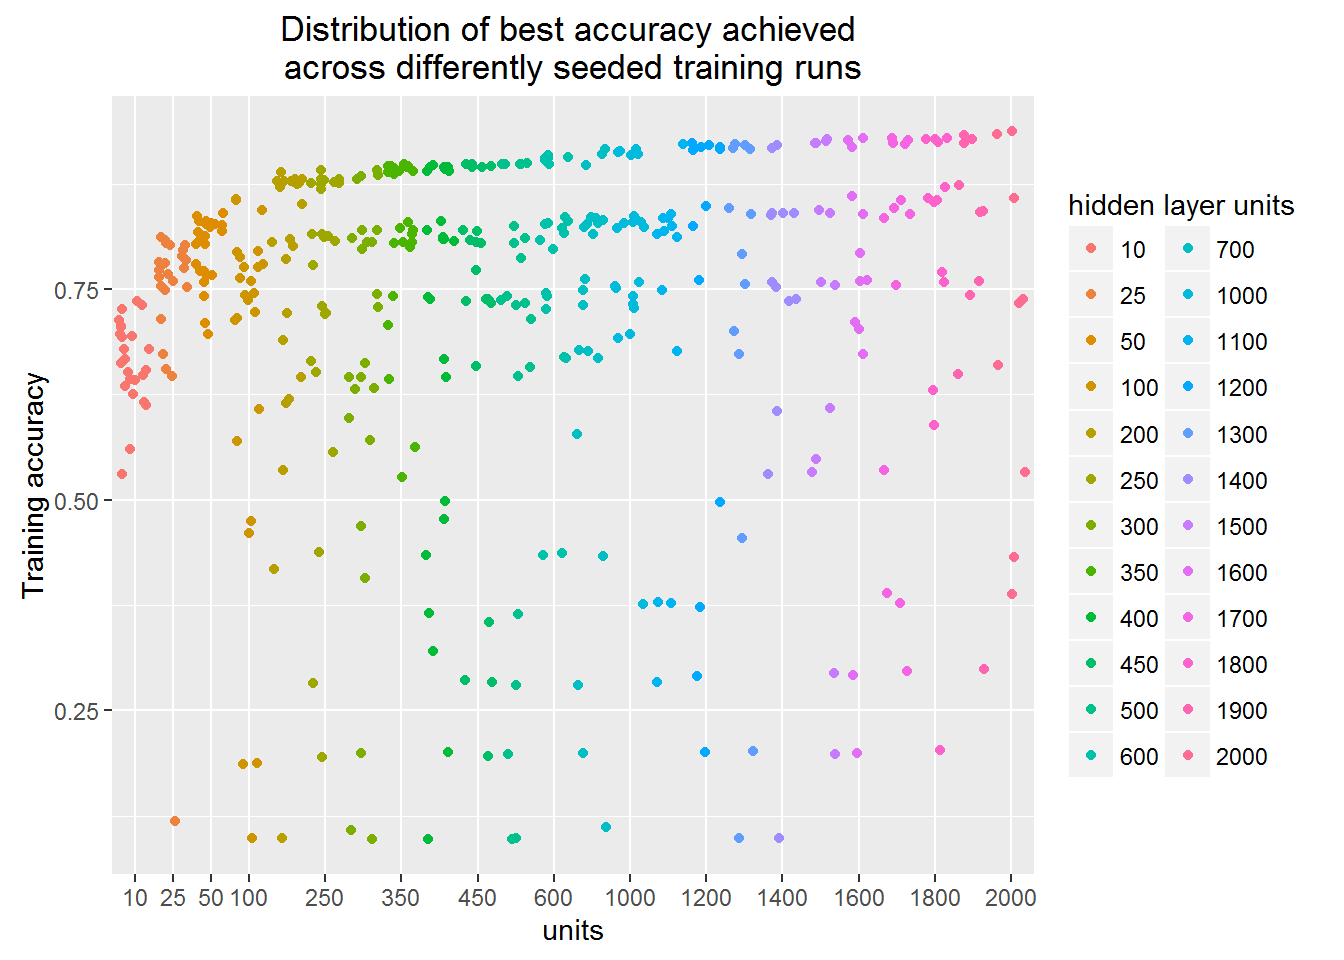
In this plot, as in the previous one, each of the dot is separate finished training run.
But in this one Y-axis depicts classification accuracy.
Interesting that the network with even 10 units can correctly classify more than a half of the images.
It is also surprising for me that the best models cluster together forming a clear gap between them and others.
Can you see the empty space stride?
Is this some particular image feature that is ether captured or not?