The creators of YOLO v3 advice to regenerate “anchors” if you retrain YOLO for your own dataset. Here I describe what are anchors, how to generate them and also give specific anchor values for traffic sign detection problem.
(If you need the anchors for training of traffic sign detection on 16:9 aspect ratio images, scroll down to the end of the post)
What is YOLO anchors?
YOLO infers bounding box around the detected object not as an arbitrary rectangle, but as an offset from one of the preconfigured bounding boxes. These bounding box presets are called anchors or anchor boxes. They are chosen to match real object bounding boxes that are common in the training set. Thus they give a clue about typical object shapes and sizes that the network should look for. Each anchor is represented as width and height. Therefore anchor fixes not only aspect ratio of a bounding box but also an exact size of it. Thus, it is crucial to tune them right. In YOLO v3 there are 9 different anchors, which are equally divided into three groups. Each group of anchors operate on separate scale of the image. See details in original paper.
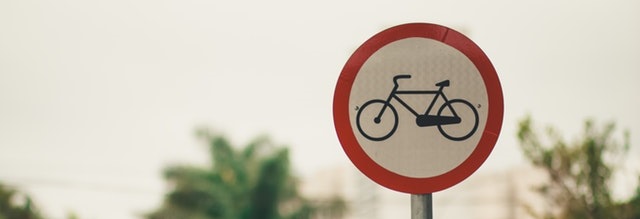
Imagine that we analyse a car camcorder video and do traffic sign detection. We are unlikely to encounter a frame where the object to detect (traffic sign) takes more than a half of a view sight. Therefore we do not need an anchor with a size about a half of the whole image or larger.
However if we do general purpose image annotation, we must be ready to detect a close up photo of an object and the usage of large size anchor can be helpful.
How to get the anchors?
To compute the anchors it is advised to do K-means clustering of the bounding boxes in the target data set. I’ll show here how to do it in R for the Russian Traffic Sign Dataset (RTSD), which is a set of wide screen (1280 x 720) images.
annotation_image_width <- 1280
annotation_image_height <- 720

yolo_image_width <- 416 # multiple of 32
yolo_image_height <- 416

df <- read.csv('data/rtsd/full-gt.csv')

# scaling bound box sizes to the Yolo v3 image size
scaled_w <- df$width / annotation_image_width * yolo_image_width
scaled_h <- df$height / annotation_image_height * yolo_image_height

df2 <- data.frame(width = scaled_w,height = scaled_h)
     width            height
 Min.   : 5.200   Min.   :  9.244
 1st Qu.: 7.475   1st Qu.: 13.289
 Median :10.400   Median : 17.911
 Mean   :12.867   Mean   : 22.273
 3rd Qu.:15.275   3rd Qu.: 26.578
 Max.   :99.775   Max.   :166.400
After we have a data frame with bounding box widths and heights we can do K-mean clustering
# do clustering in reproducible way
set.seed(20)
rtsdCluster <- kmeans(df2, 9, nstart = 20)
clusters <- as.data.frame(rtsdCluster$centers)

# rounding to get exact pixel value
clusters$width <- round(clusters$width)
clusters$height <- round(clusters$height)

# calculation of bounding box area for sorting
clusters$area <- clusters$width * clusters$height

# and finally sorting
clusters <- clusters[order(clusters$area),]
clusters
  width height area
9     7     12   84
1    10     17  170
6    13     24  312
4    26     20  520
3    17     32  544
5    23     41  943
2    31     54 1674
7    41     72 2952
8    58    100 5800
YOLO Anchors for traffic sign detection
Original COCO dataset YOLO v3 anchors are:
10,13, 16,30, 33,23, 30,61, 62,45, 59,119, 116,90, 156,198, 373,326
([width,height] pairs scaled to the YOLO internal image size)
They are suitable for general purpose all scales object detection.
In contrast, for the traffic sign detection in car camcorder videos of aspect ratio 16:9 and YOLO image size of 416×416,the anchors are:
7,12, 10,17, 13,24, 26,20, 17,32, 23,41, 31,54, 41,72, 58,100
You can see that the size of the anchors is considerably smaller. That’s because we face only traffic signs that are in middle or long range from the camera.
For more info about YOLO v3 in general see this post or original homepage.