COVID-19 Latent period estimation

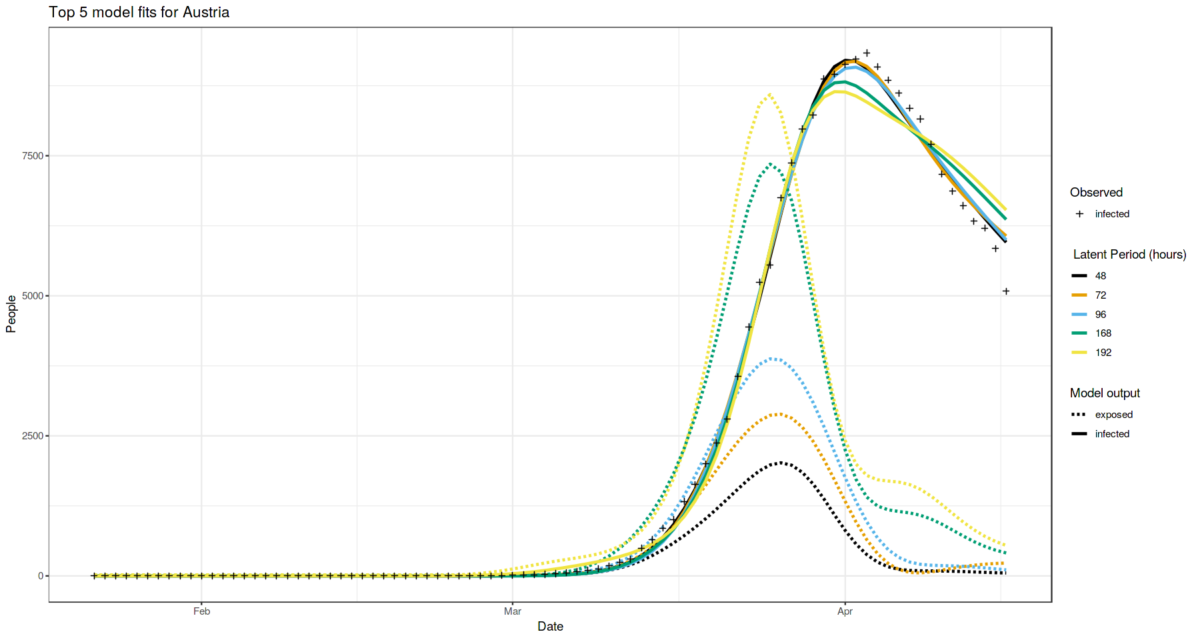
The incubation period for the COVID-19 is reported many times. We can’t say the same for the latent period (the period since the person is infected but does not spread the infection yet), which is vital characteristic of every infectious disease. Knowing the latent period gives an ability to run simulations which are far more accurate. In this study I try to estimate the latent period for COVID-19 caused by SARS-CoV-2 virus via computational simulations using SEIR model with different values controlling the latent period length (e.g. latent period parameter sweep). I try to fit all other parameters to match the observed statistics the best. I do such modelling for 5 different locations worldwide which are currently experiencing different stages of the epidemic.

As a result, Europe locations suggest that latent period is between 2 and 4 days: Austria case suggests the value of 48-96 hours, Italy case suggests the value greater than 48 hours. While China cases suggest shorter latent period.

Continue reading “COVID-19 Latent period estimation”

Anomaly detection system. Case study

The problem

There is a coldproof box with electronics (e.g. smart house control center).
We need to detect any environmental anomalies inside the box-case like overheating, coldproof failure or any other.

The plan

  1. The first thing to do is to gather some measurements data of normal system operation.
  2. Define a probabilistic model of normal operation.
  3. Continue reading “Anomaly detection system. Case study”

Solar wind simulation: particle bursts engine

Intro

The Solar Wind Particle Burst Engine models the solar wind by simulating bursts of particles emitted by coronal holes. The idea is to simulate continuous flow of particles using discrete representation of the world. We can represent the wind as a finite number of particle bursts. The world space is one dimensional. It is represented with finite number of bins. The bins are enumerated with index. Greater the index, greater the distance of the bin from the Sun. Therefore the bin with index 0 corresponds to the Sun surface. Each bin at every particular time moment can “contain” zero or more particle bursts. At every world time tick (the time is modelled in a discrete way in form of integer ticks) the particle bursts move out of the Sun by leaving one bin and getting into another.
Continue reading “Solar wind simulation: particle bursts engine”

Solar wind observations by EPAM ACE

This is a part of study described in the dedicated post.

We have per minute solar wind observations (density, temperature and velocity) recorded by EPAM instrument of Advanced Composition Explorer (ACE) spacecraft. (see this link for data files)

This data from ACE can be used for two purposes. First, we can use this particular archive of observations (e.g. 2015 year) to fit the prediction model parameters. Second, we can use very recent measurements coming from ACE as predictors for forecasting the wind velocity for near future.
Continue reading “Solar wind observations by EPAM ACE”

Extracting possible solar wind predictors

This is a part of study described in the dedicated post.

I am going to perform data clean up and feature extraction for Solar wind model fitting. The major predictor of the solar wind is considered to be coronal holes characteristics (e.g. see this paper)

I’ve got two CSV data sets that contain quantitative features extracted from the Sun images with computer vision algorithms.
One file is “green” (193nm) spectrum portion originated features, another one is “red” (211nm) spectrum portion originated features
Continue reading “Extracting possible solar wind predictors”

Solar wind prediction

I’m going to do an experiment of predicting the solar wind speed near the Earth based on the series of the Sun images.

Skobeltsyn Institute of Nuclear Physics of Moscow State University publishes observation and prediction data on space weather. Solar wind prediction is also published there. My experiment is to try to build more accurate prediction based on the same initial data from SINP MSU.

The experiment is the following:

  1. Take the data from SINP MSU
  2. Prepare features data to be used as predictors
  3. Prepare observational data to be used as reference values
  4. Calculate error rates for current SINP MSU model
  5. Designing the computational model for the solar wind
  6. Fit Pulse-based model of solar wind, calculate error rates
  7. Fit machine learining regression
  8. Compare the error rates of each of the models

For each of this experiment phases I will publish a separate post.