The incubation period for the COVID-19 is reported many times. We can’t say the same for the latent period (the period since the person is infected but does not spread the infection yet), which is vital characteristic of every infectious disease. Knowing the latent period gives an ability to run simulations which are far more accurate. In this study I try to estimate the latent period for COVID-19 caused by SARS-CoV-2 virus via computational simulations using SEIR model with different values controlling the latent period length (e.g. latent period parameter sweep). I try to fit all other parameters to match the observed statistics the best. I do such modelling for 5 different locations worldwide which are currently experiencing different stages of the epidemic.
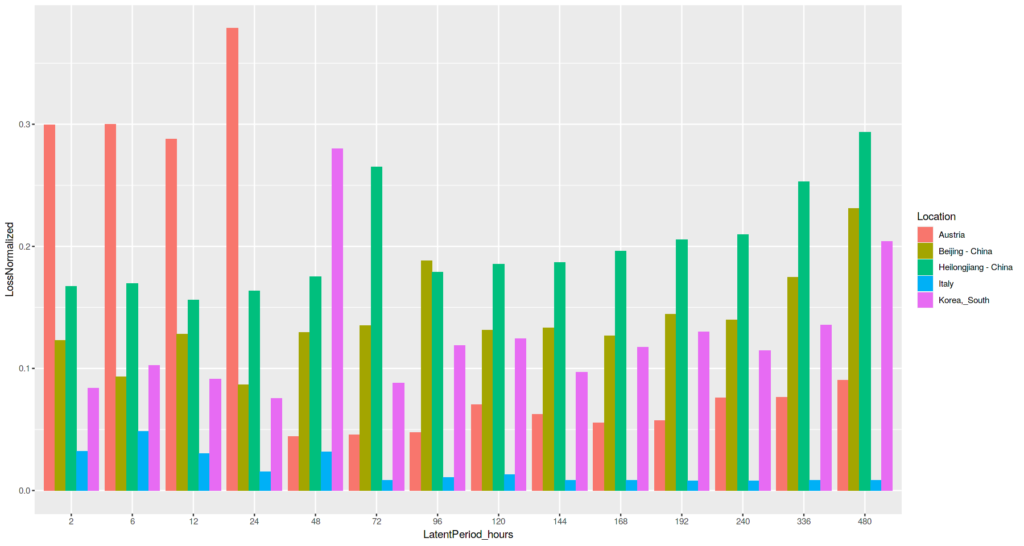
As a result, Europe locations suggest that latent period is between 2 and 4 days: Austria case suggests the value of 48-96 hours, Italy case suggests the value greater than 48 hours. While China cases suggest shorter latent period.
Introduction
The data
I use the time series data (infected count, recovered count and deaths count) published by the John Hopkins University as ground truth observations.
I experiment with these 5 locations:
- Austria (infection peak has passed)
- Beijing, China (there were 2 peaks)
- Heilongjiang, China (two more distinct peaks)
- Italy (Peak is approaching)
- South Korea (single peak passed long ago)
The model
I use SEIR model where the population is split into 4 groups:
- S – susceptible, subjects who can catch the infection
- E – exposed, subjects who is infected but not yet contagious (e.g. in incubation period)
- I – infected, contagious subjects
- R – removed, subjects either recovered or died due to disease
The dynamics of transition between the groups is defined as ODE system.
where β (beta), σ (sigma) and γ (gamma) are parameters that control the transition rates.
Latent period estimation
Latent period can be estimated as reciprocal to sigma parameter. Thus latent period = 1.0 / sigma
The parameter fitting procedure
I let the optimizer to fit the following parameters:
- Infection start date
- number of the exposed people count on the first day of infection
- number of the infected people count on the first day of infection
- beta (separate value per week, approximated with spline before passing to ODE) – infection rate
- gamma – recovery rate
The loss function is RMSE.
For every location and every value of sigma (reciprocal of latent period) I use several runs of Nelder-Mead and BFGS optimizers starting at different random initial conditions and take the best fit.
The full computational experiment code is published on the GitHub.
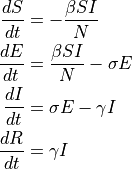
Italy case
We can see that short latent period values (2 hours – 48 hours) exhibit higher values of achieved loss value, thus less likely to describe the observations in a valid way.
But we can’t see any explicit single latent period value longer than 48 hours, that exhibits much lower loss. All of values starting from 72 hours and higher seem to be possible.
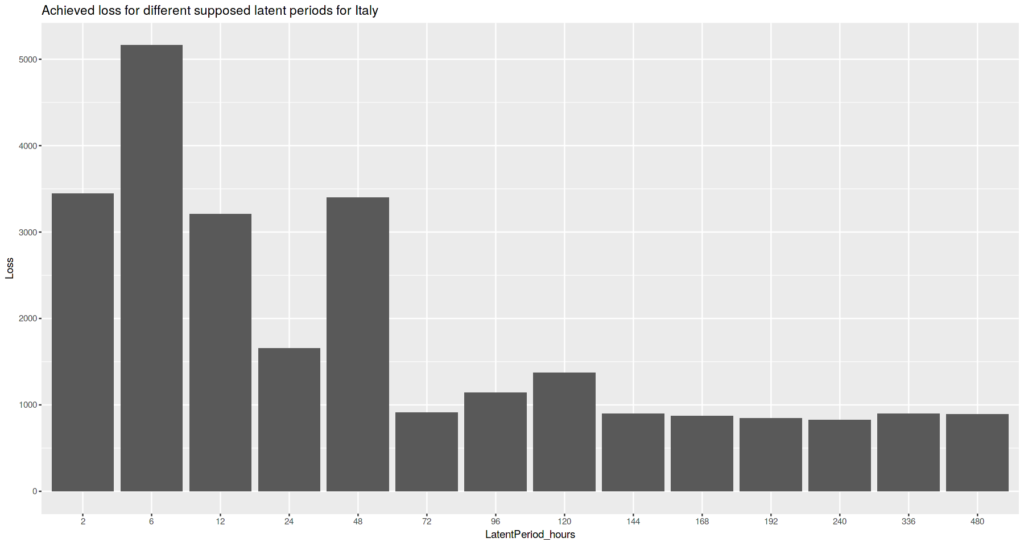
Top fits match the observed infected count almost perfectly for Italy. Wide range of "valid" latent periods are equally possible.
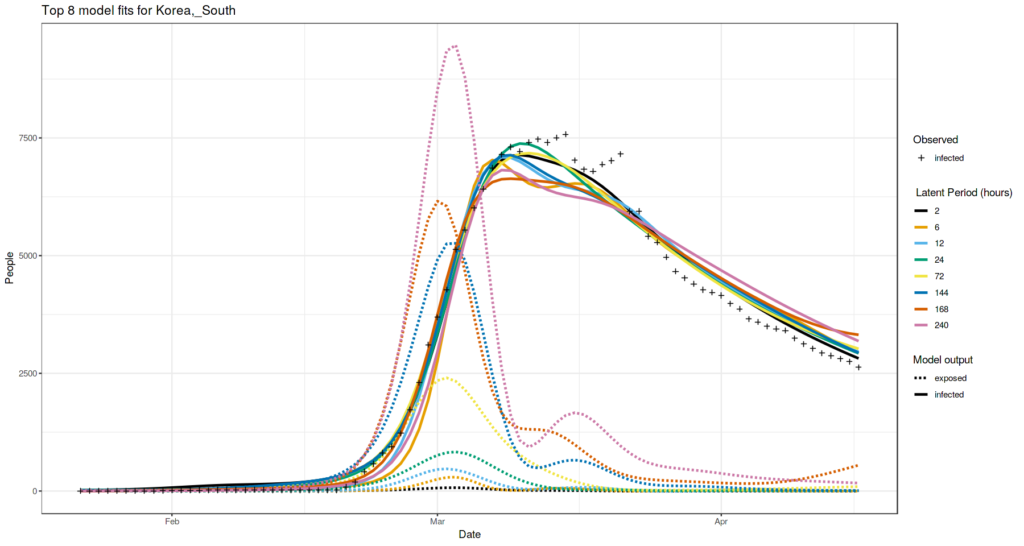
South Korea case
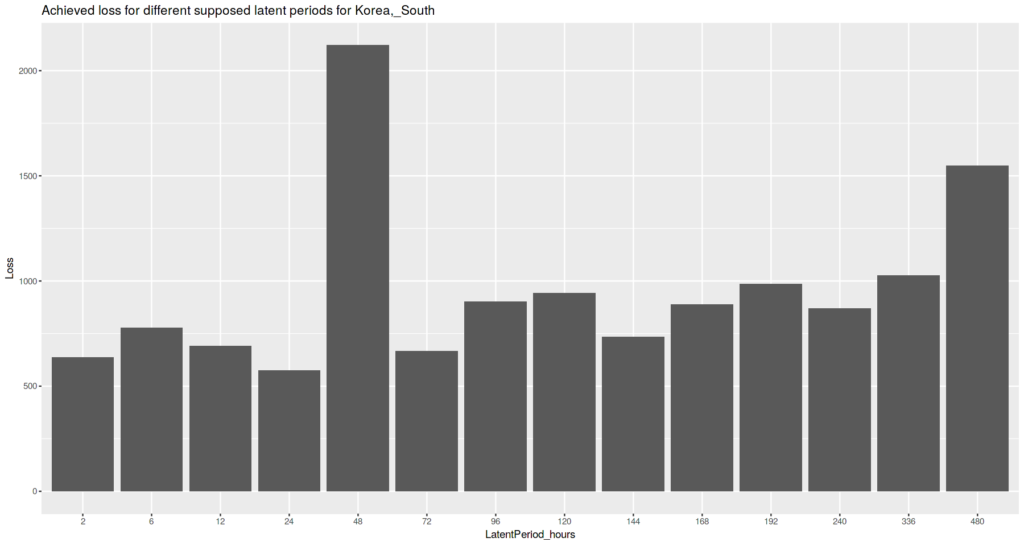
For South Korea case we can’t see any ranges of the supposed latent period length that are more likely than others. Even very short latent period of 2 hours still gives a possibility of a good observed values fit.
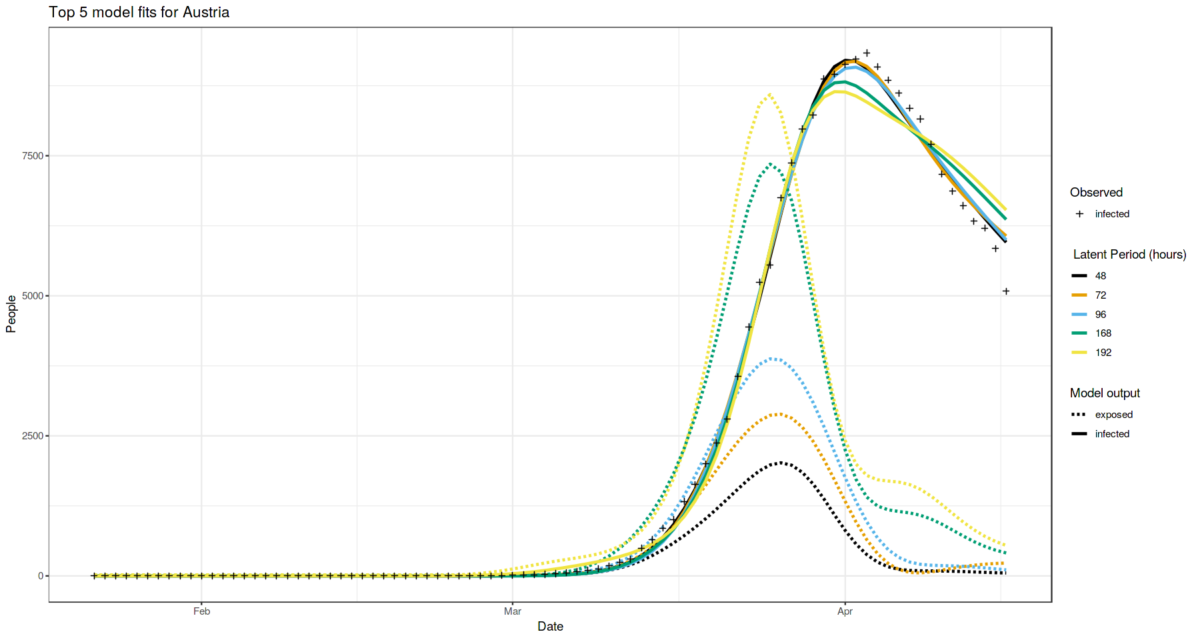
Austria case
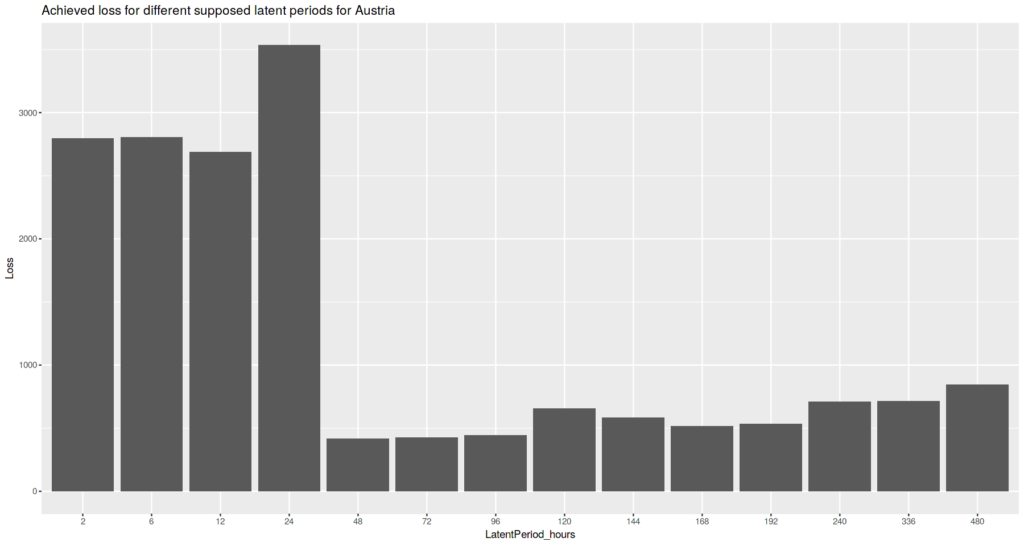
Austria case suggests that latent period length shorter than 48 hours are unlikely to produce good looking simulations.
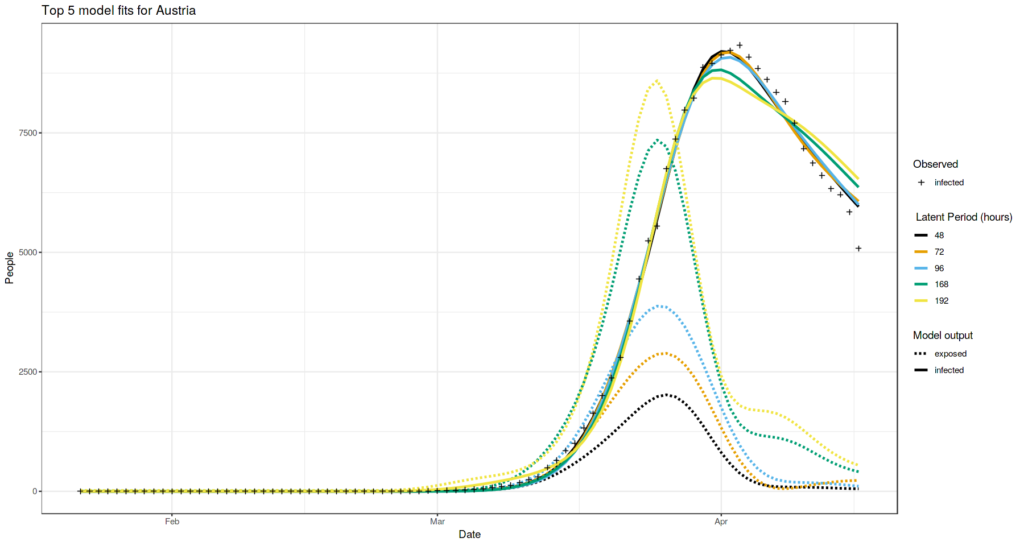
The distinct group of values equal to 48, 72 and 96 hours produce the simulations that are most close to the observed values
Beijing case
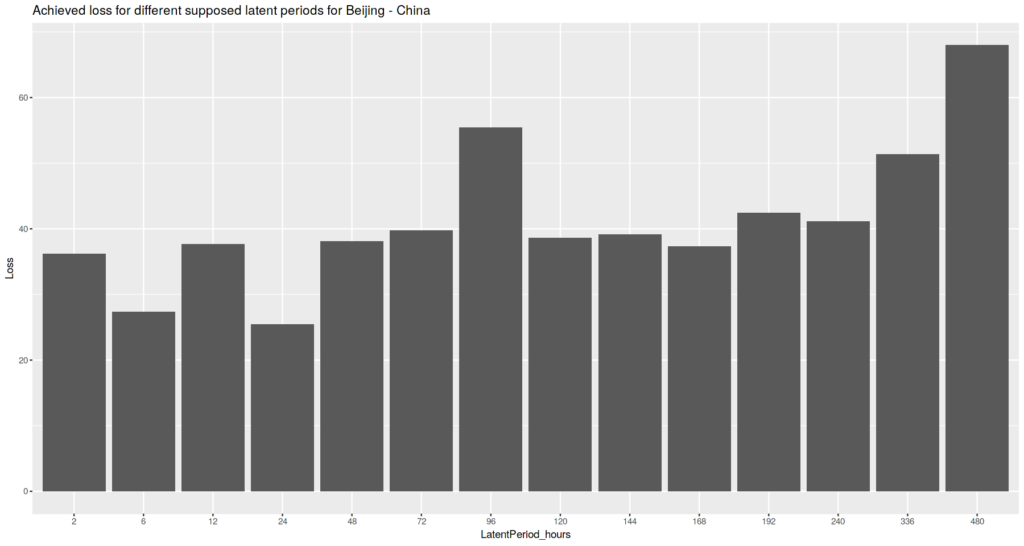
Short values of 6 and 24 hours are more likely to describe the observed data.
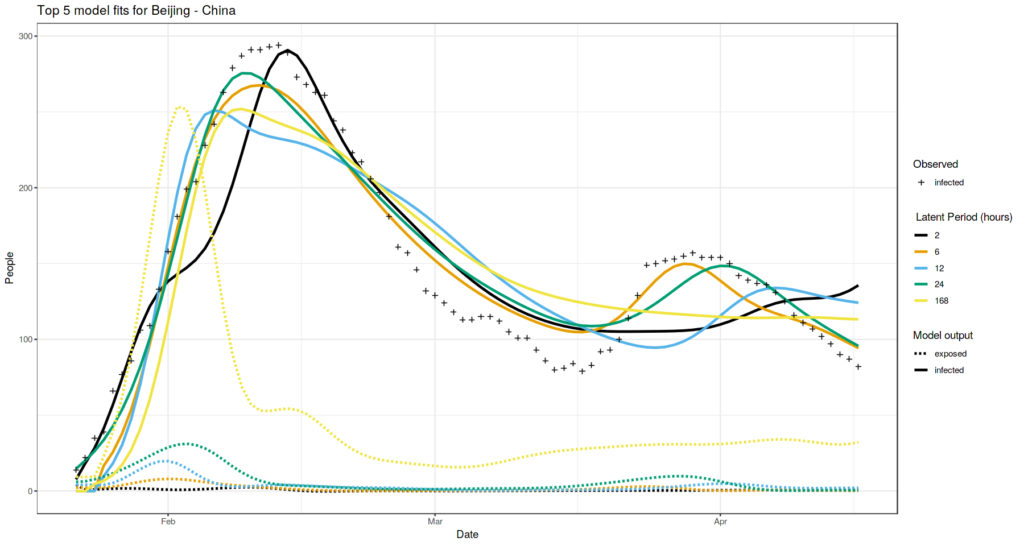
But visual exploration suggests that the value of 6 hours is more likely.
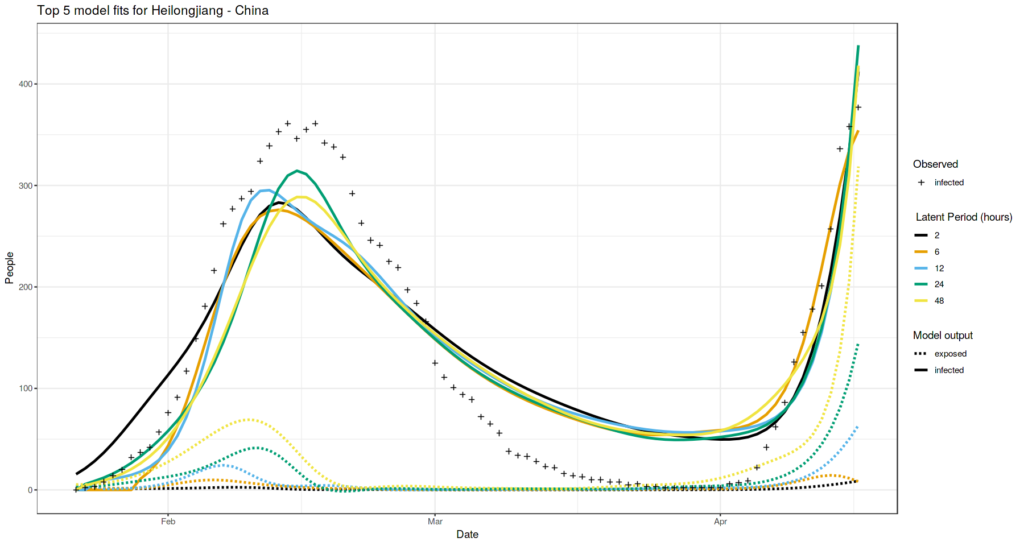
Heilongjiang, China case
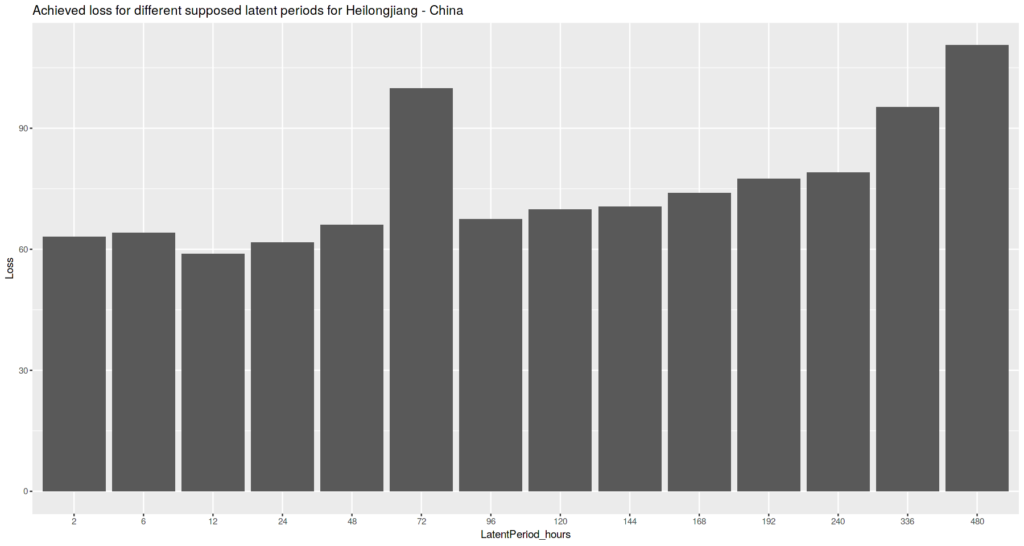
Observed trend is that for higher latent period values achieved loss is little bit higher.
Again, there is no distinct value for the latent period that gives the outstanding minimum.
An attempt to normalize loss values across all locations
Summary
Europe locations suggest that latent period is between 2 and 4 days: Austria case suggests the value of 48-96 hours, Italy case suggests the value greater than 48 hours. While China cases suggest shorter latent period.
Need more details?
I published the data as Kaggle DataSet. The figure producing code is also available as Jupyter Notebook on Kaggle.
Future work
I need to carry out statistical hypothesis testing to evaluate the significance of the results.
Thank you!!1