Here I share the recipe for how to setup High Availability Traefik Proxy (multiple instances) for Kubernetes with TLS certificates obtained from LetsEncrypt with help of Cert Manager.
Continue reading “High Availability Traefik for K8s (IngressRoute + Cert Manager + LetsEncrypt)”COVID-19 Latent period estimation
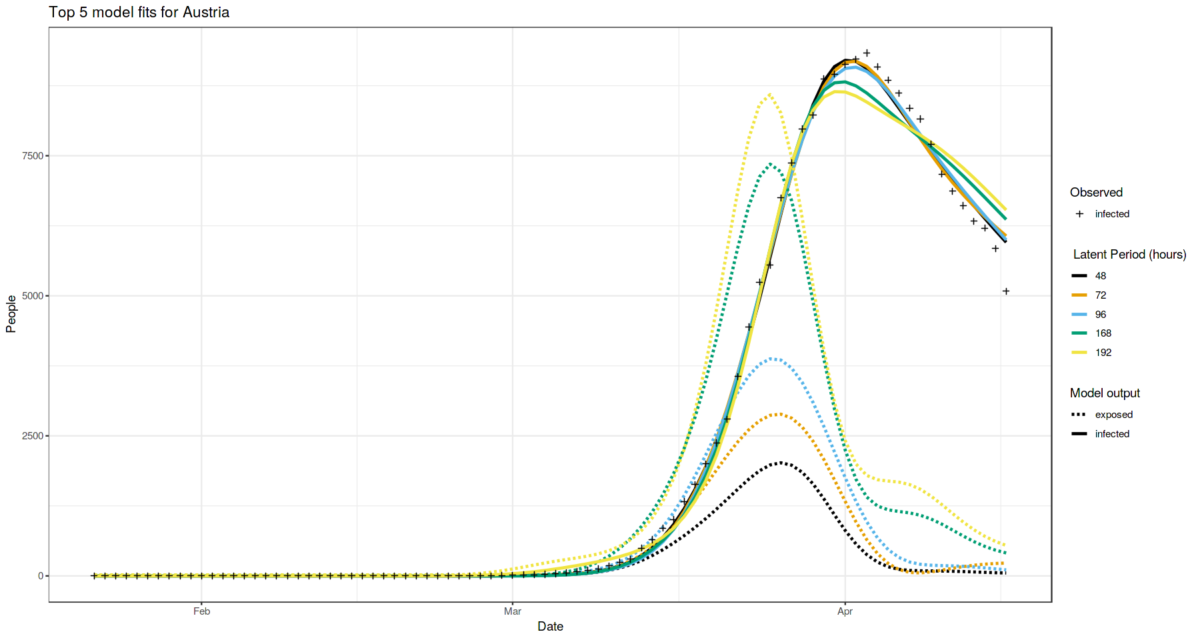
The incubation period for the COVID-19 is reported many times. We can’t say the same for the latent period (the period since the person is infected but does not spread the infection yet), which is vital characteristic of every infectious disease. Knowing the latent period gives an ability to run simulations which are far more accurate. In this study I try to estimate the latent period for COVID-19 caused by SARS-CoV-2 virus via computational simulations using SEIR model with different values controlling the latent period length (e.g. latent period parameter sweep). I try to fit all other parameters to match the observed statistics the best. I do such modelling for 5 different locations worldwide which are currently experiencing different stages of the epidemic.
As a result, Europe locations suggest that latent period is between 2 and 4 days: Austria case suggests the value of 48-96 hours, Italy case suggests the value greater than 48 hours. While China cases suggest shorter latent period.
YOLO v3 anchors for traffic sign detection
The creators of YOLO v3 advice to regenerate “anchors” if you retrain YOLO for your own dataset. Here I describe what are anchors, how to generate them and also give specific anchor values for traffic sign detection problem.

(If you need the anchors for training of traffic sign detection on 16:9 aspect ratio images, scroll down to the end of the post)
Continue reading “YOLO v3 anchors for traffic sign detection”Birdsong.report B1 Model Classification Quality
Here are some important notices about the classification quality of B1 model currently deployed at (birdsong.report)
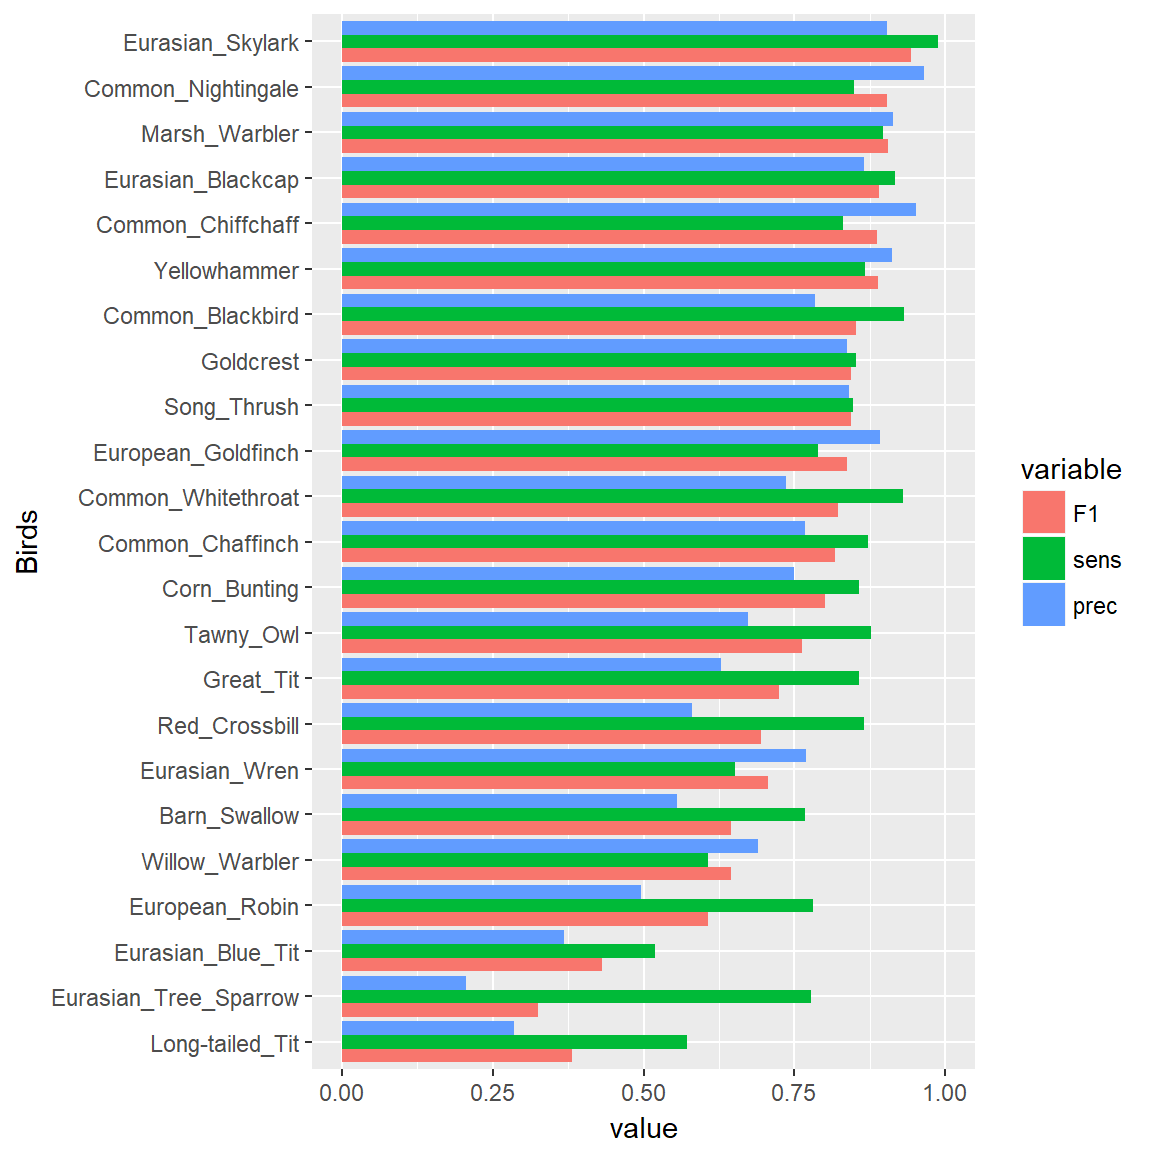
I made per class classification quality analysis (don’t know why I did not do it before!) and the results are both impressive and distressing.
Continue reading “Birdsong.report B1 Model Classification Quality”
Anomaly detection system. Case study
The problem
There is a coldproof box with electronics (e.g. smart house control center).
We need to detect any environmental anomalies inside the box-case like overheating, coldproof failure or any other.
The plan
- The first thing to do is to gather some measurements data of normal system operation.
- Define a probabilistic model of normal operation.
My bird song classifier
In this post I describe the neural network architecture that I try as a bird song classifier.
Intro
When I first came up with an idea of building a bird song classifier I started to google for the training dataset.
I found xeno-canto.org and the first thing that caught my attention was spectrograms.

(Sepctrogram is visual representation of how spectrum evolves through time. The vertical axis reflects frequency, the horizontal represents time. Bright pixels on the spectrogram indicate that for this particular time there is a signal of this particular frequency)
Well, spectrograms are ideal for visual pattern matching!
Why do I need to analyse sound when we have such expressive visual patterns of songs? That was my thoughts.
I decided to train neural net to classify spectrograms.
Xeno Canto top 30 European birds
My current hobby is creation of Shazam like service for bird songs. I started with looking for a birds songs dataset. Fortunately there is a Xeno Canto site which is crowd-sourcing platform for building up bird songs and calls database.
I decided to start with classification of 30 most commonly recorded European birds.
Multilayer perceptron learning capacity
In this post I demonstrate how the capacity (e.g. classifier variance) changes in multilayer perceptron classifier with the change of hidden layer units.
As a training data I use MNIST dataset published on Kaggle as a training competition.
The network is multiclass classifier with single hidden layer, sigmoid activation.
Multi-class logarithmic loss
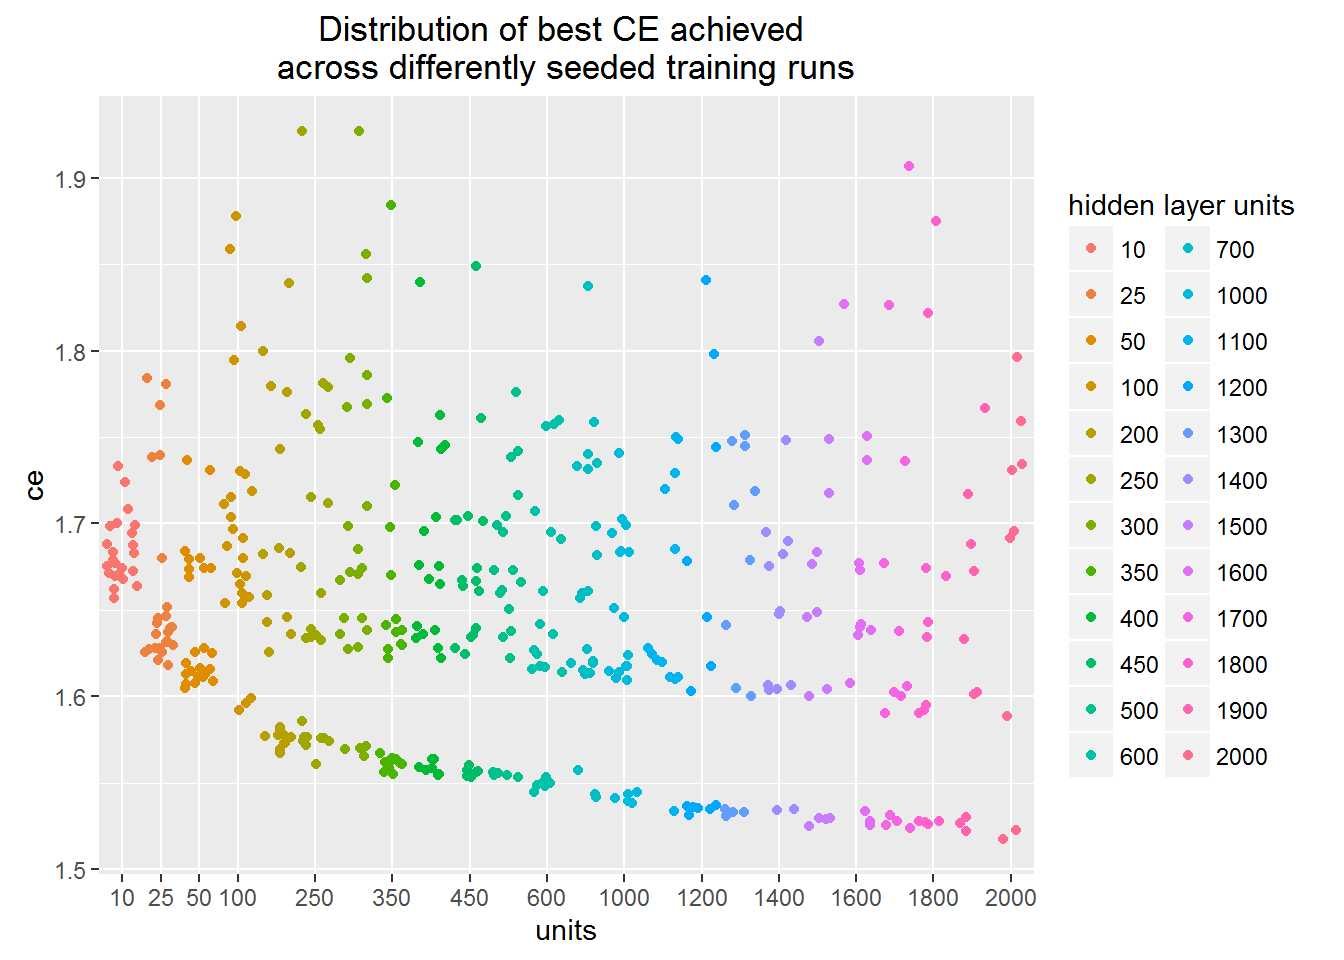
The plot shows the minimum value of loss function achieved across different training runs.
Each dot in the figure corresponds to a separate training run finished by stucking in some minimum of the loss function.
You may see that the training procedure can stuck in the local minimum regardless of the hidden units number.
This means that one needs to carry out many training runs in order to figure out real network architecture learning capacity.
The lower boundary of the point cloud depicts the learning capacity. We can see that learning capacity slowly rises as we increase the number of hidden layer units.
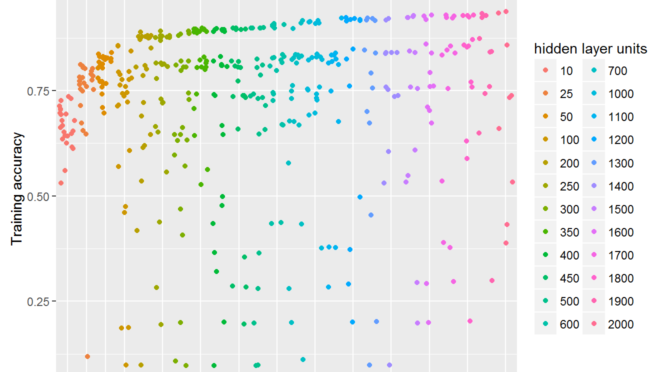
Classification accuracy
Learning capacity is also reflected into the achieved accuracy.
In this plot, as in the previous one, each of the dot is separate finished training run.
But in this one Y-axis depicts classification accuracy.
Interesting that the network with even 10 units can correctly classify more than a half of the images.
It is also surprising for me that the best models cluster together forming a clear gap between them and others.
Can you see the empty space stride?
Is this some particular image feature that is ether captured or not?
Solar wind computational model
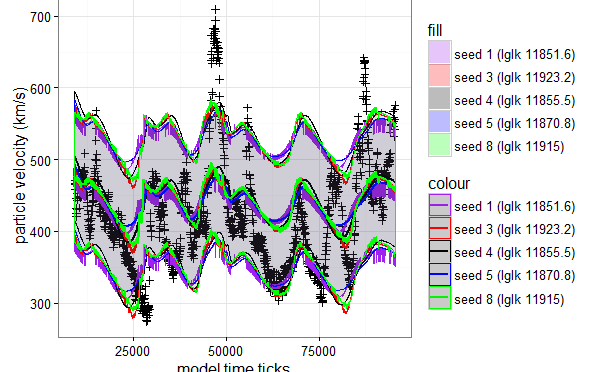
I’m going to build predictive solar wind computational model using Particle burst engine and estimate its parameters.
Continue reading “Solar wind computational model”
Solar wind simulation: particle bursts engine
Intro
The Solar Wind Particle Burst Engine models the solar wind by simulating bursts of particles emitted by coronal holes. The idea is to simulate continuous flow of particles using discrete representation of the world. We can represent the wind as a finite number of particle bursts. The world space is one dimensional. It is represented with finite number of bins. The bins are enumerated with index. Greater the index, greater the distance of the bin from the Sun. Therefore the bin with index 0 corresponds to the Sun surface. Each bin at every particular time moment can “contain” zero or more particle bursts. At every world time tick (the time is modelled in a discrete way in form of integer ticks) the particle bursts move out of the Sun by leaving one bin and getting into another.
Continue reading “Solar wind simulation: particle bursts engine”

